
Tepper

David Tepper’s $23 billion hedge fund, Appaloosa Management, is about 40% in cash. Meanwhile…
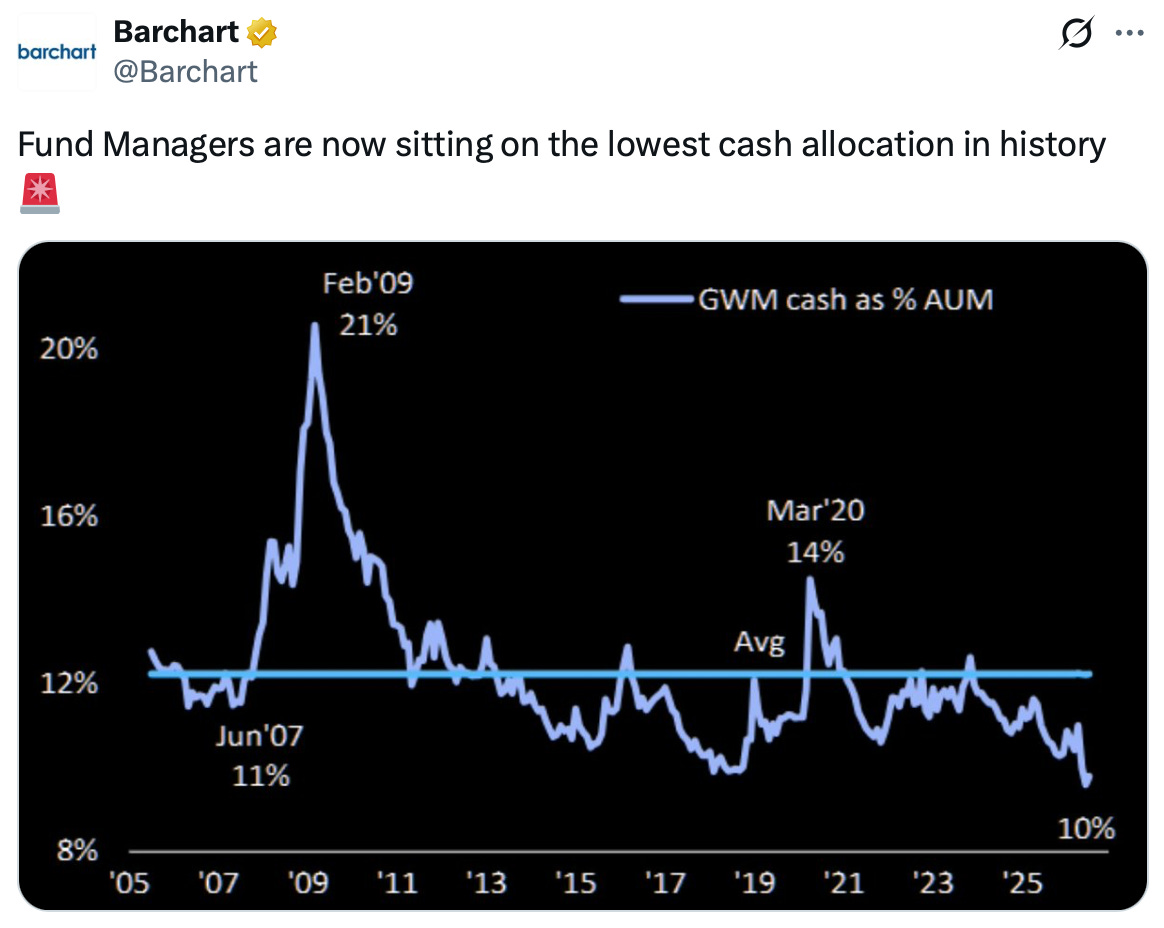
Tepper was also 40% cash in the fall of 2007. He talked about the position to students at Carnegie Mellon University:
“Right now we’re pretty cautious. We actually have the biggest cash position we’ve ever had. We’re probably about 40 percent in cash and we never run cash. The reason I’m that way is because I do think margins are shrinking. A lot of industries started with sub-prime. So I’m pretty cautious, and on the other hand, I’m nervous to be short, because there’s so much liquidity and the Fed may continue to ease rates, so you can get a liquidity-driven market.
I actually think that we’re in this period similar to like ’98, ’99, 2000, when the NASDAQ bubbled up. This bubble right now is happening in Hong Kong, in Brazil, in their stock markets… China’s stock market. You get this bubbling up that’s caused by our monetary policy.
So we’re in cash, because I don’t like margins coming down. I think profitability’s going to be hurt, but at the same time, I’m nervous about the Fed easing. If it was a normal easing period you could be in there, but I think you’re in that ’98, ’99, 2000 period. In that period, you had over-capacity in tech companies because of easy money.
We talked about the crisis in ’98 before, and Y2K. They eased money further, so you had money flowing in from the Fed. You couldn’t say it was a policy mistake of some sort. Money flowed in and the NASDAQ bubbled up and then it crashed. And it crashed mostly because of over supply capacity. I’m of the opinion that you could have a similar situation right now, that even though you have margins down, you could have so much liquidity from Fed easing in our market. And what’s happening is they’re building too much capacity in China in everything.
I’m not short, because I’m nervous about the liquidity. The market can go up, so that’s why I have this cash, which is a great hedge. I’ll tell you this: it’s the best hedge; nothing else is as great a hedge. You can learn anything you want at Carnegie Mellon, I’m telling you right now, you can’t hedge yourself like being only cash at a time.”
The Fed did continue to ease rates, but the economy was already in trouble. Stocks ultimately fell roughly 57% from peak to trough — October 2007 to March 2009.
While many investors were panicking, Tepper made one of the greatest investments in hedge fund history: He bet heavily that major banks would not go under, buying Bank of America at $3.72 and Citigroup at $0.79.
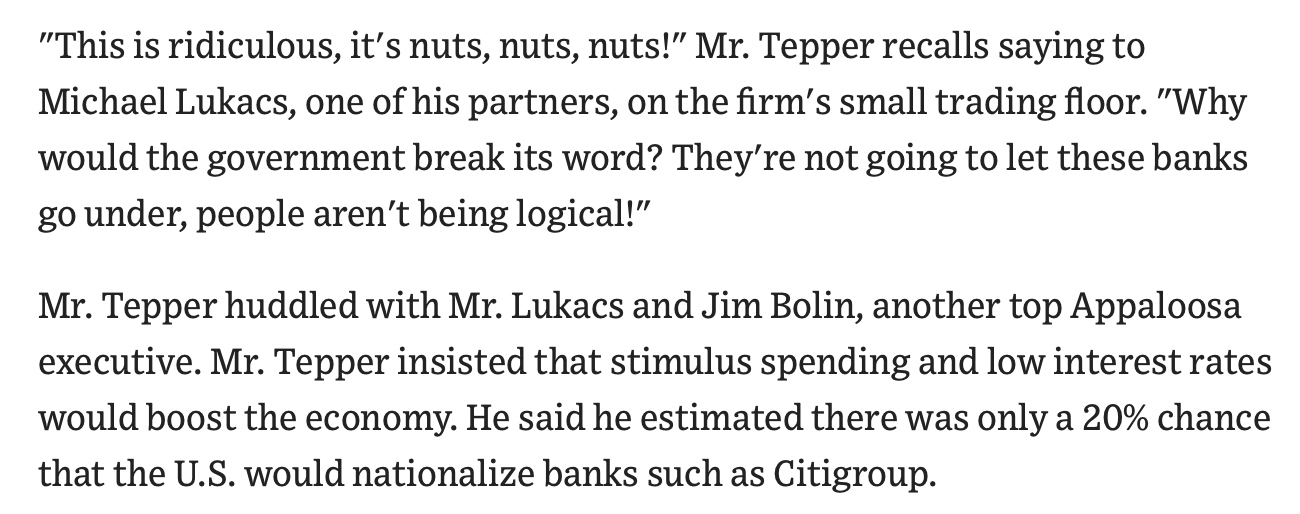
The banks were not nationalized. They were bailed out by the government instead, and Appaloosa returned approximately 132% in 2009. Tepper personally made around $4 billion that year.
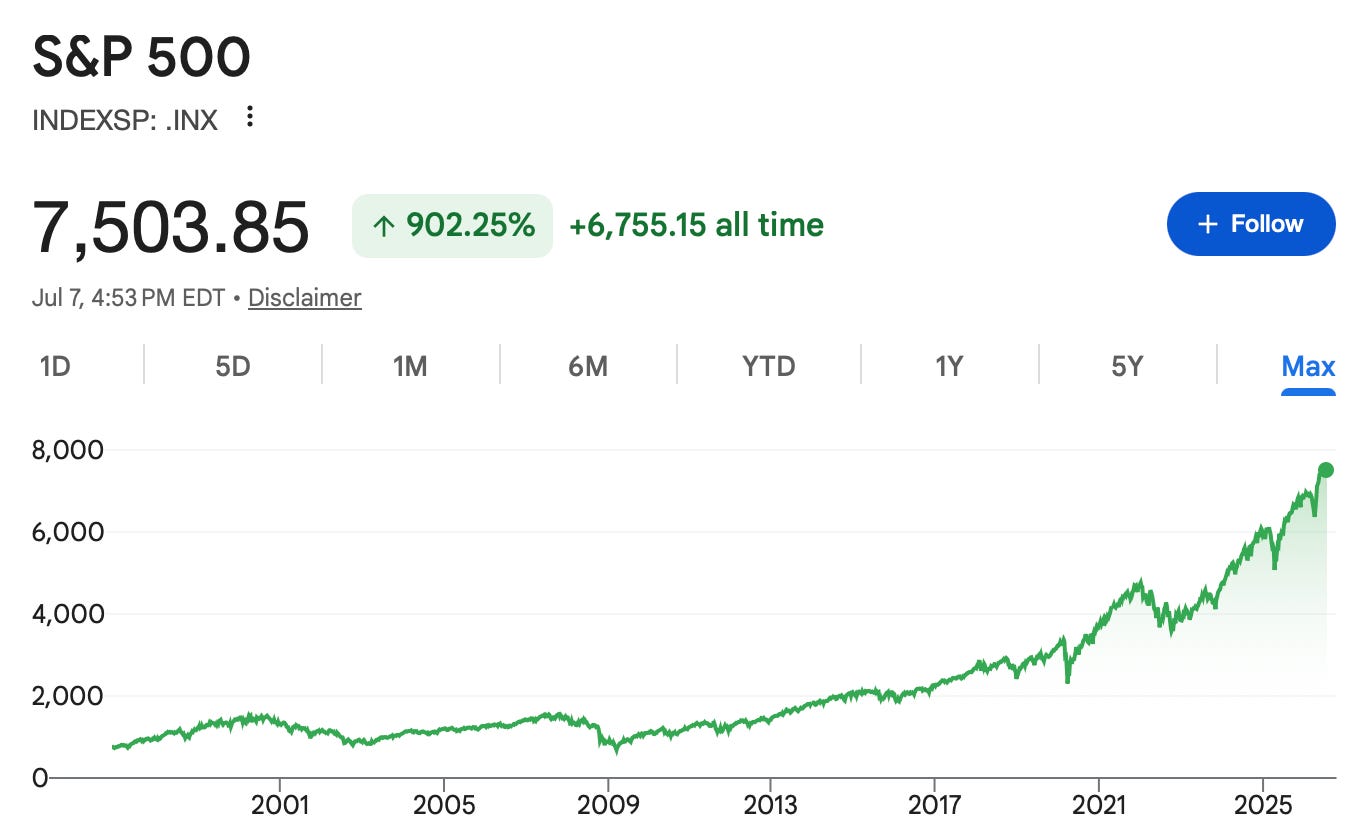
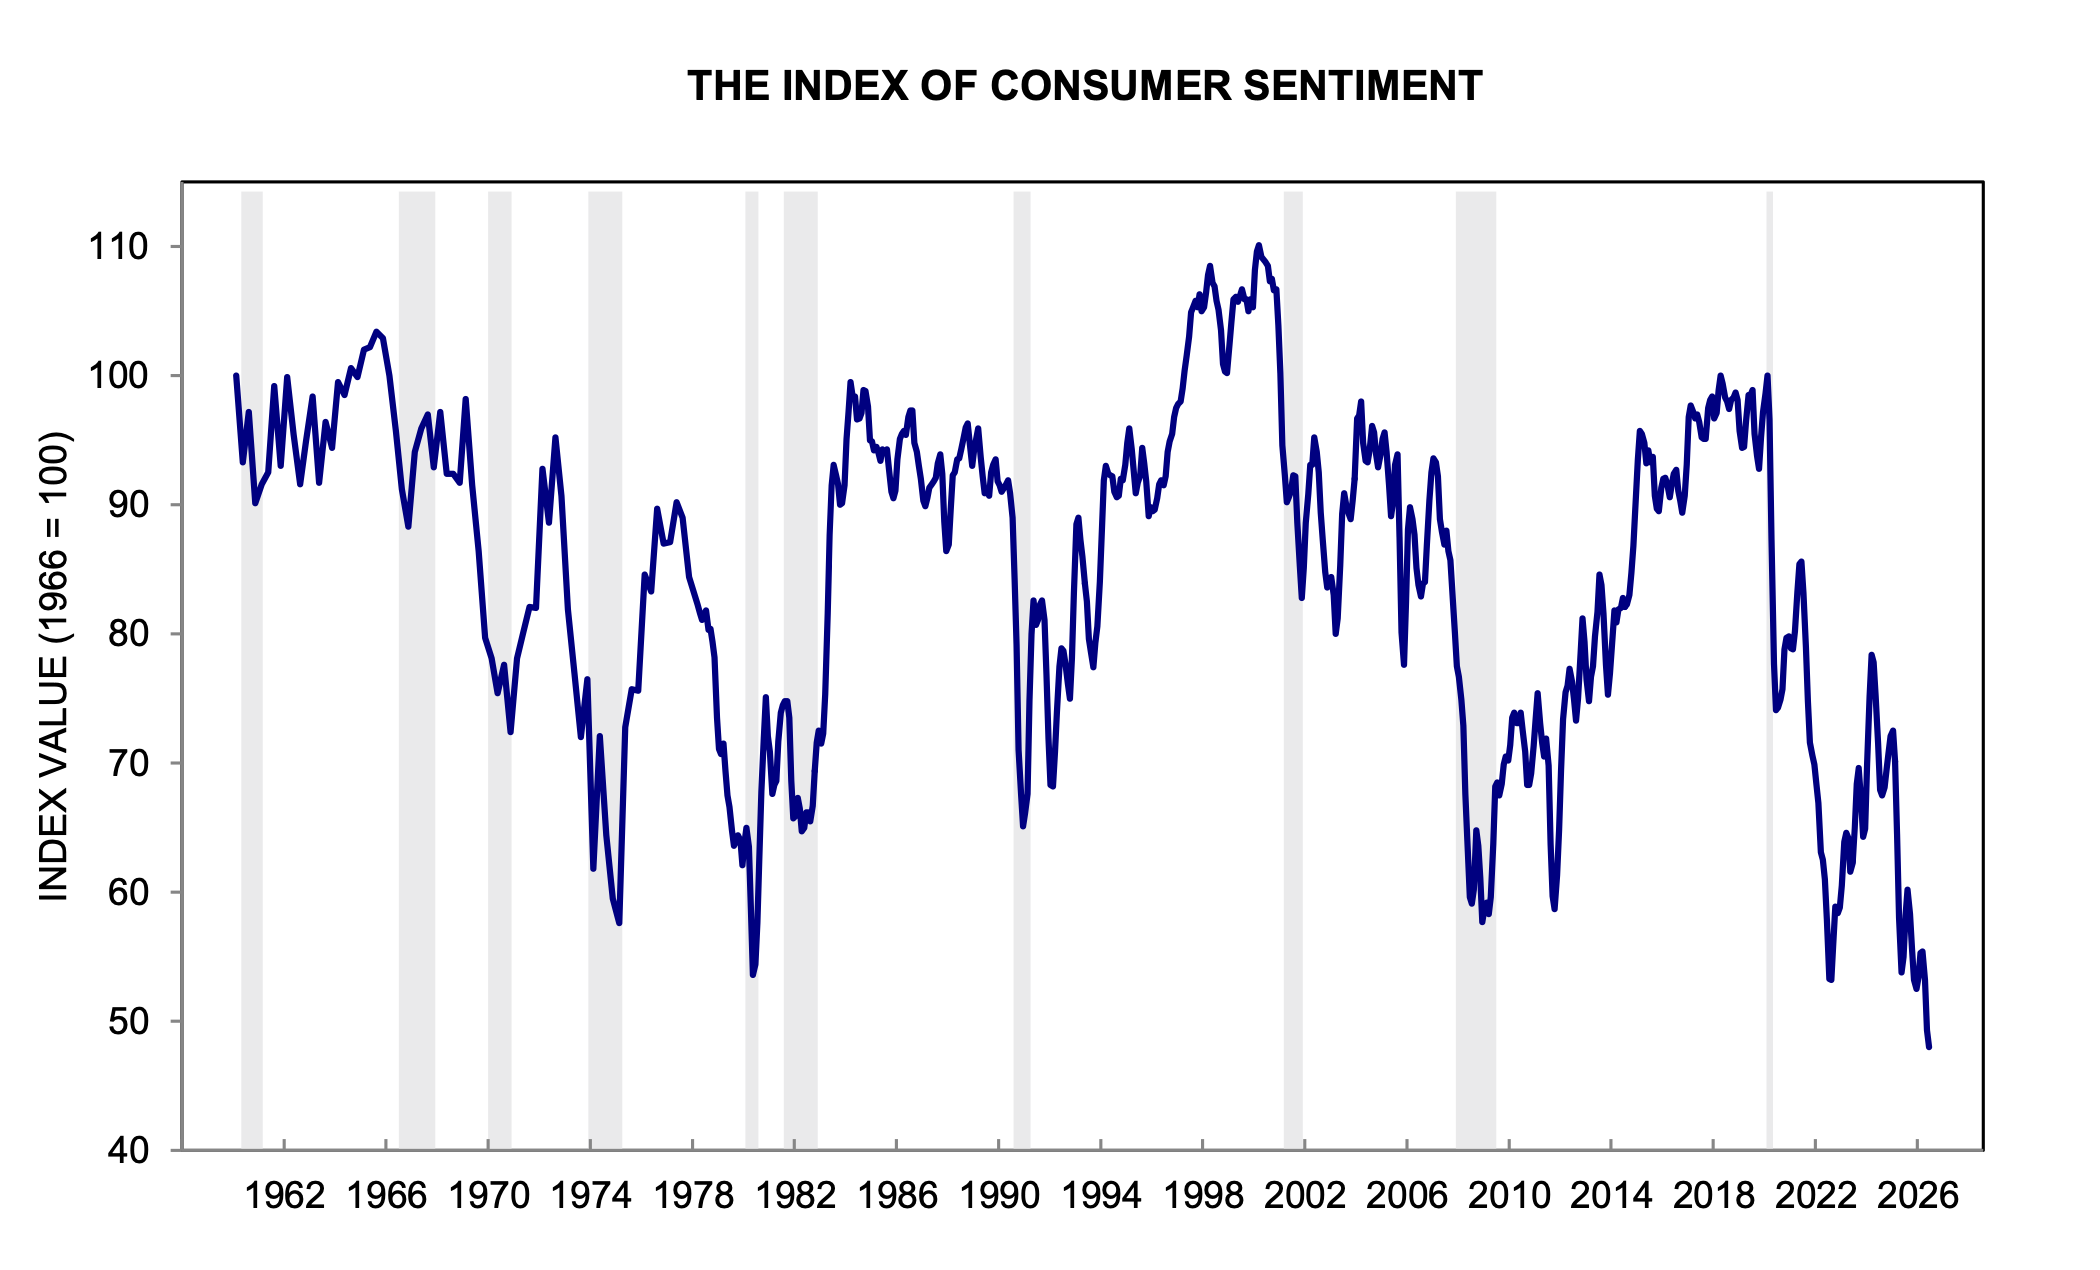
Today feels similar to past periods that led to downturns — when stocks priced for perfection were met with pain instead. The S&P 500 trades at 28x earnings with the ten-year at 4.5%, yet consumer sentiment is near all-time lows and private credit defaults are at record highs. The index remains heavily concentrated as well, with tech and financials accounting for 38.6% and 11.3% of the weighting, respectively.

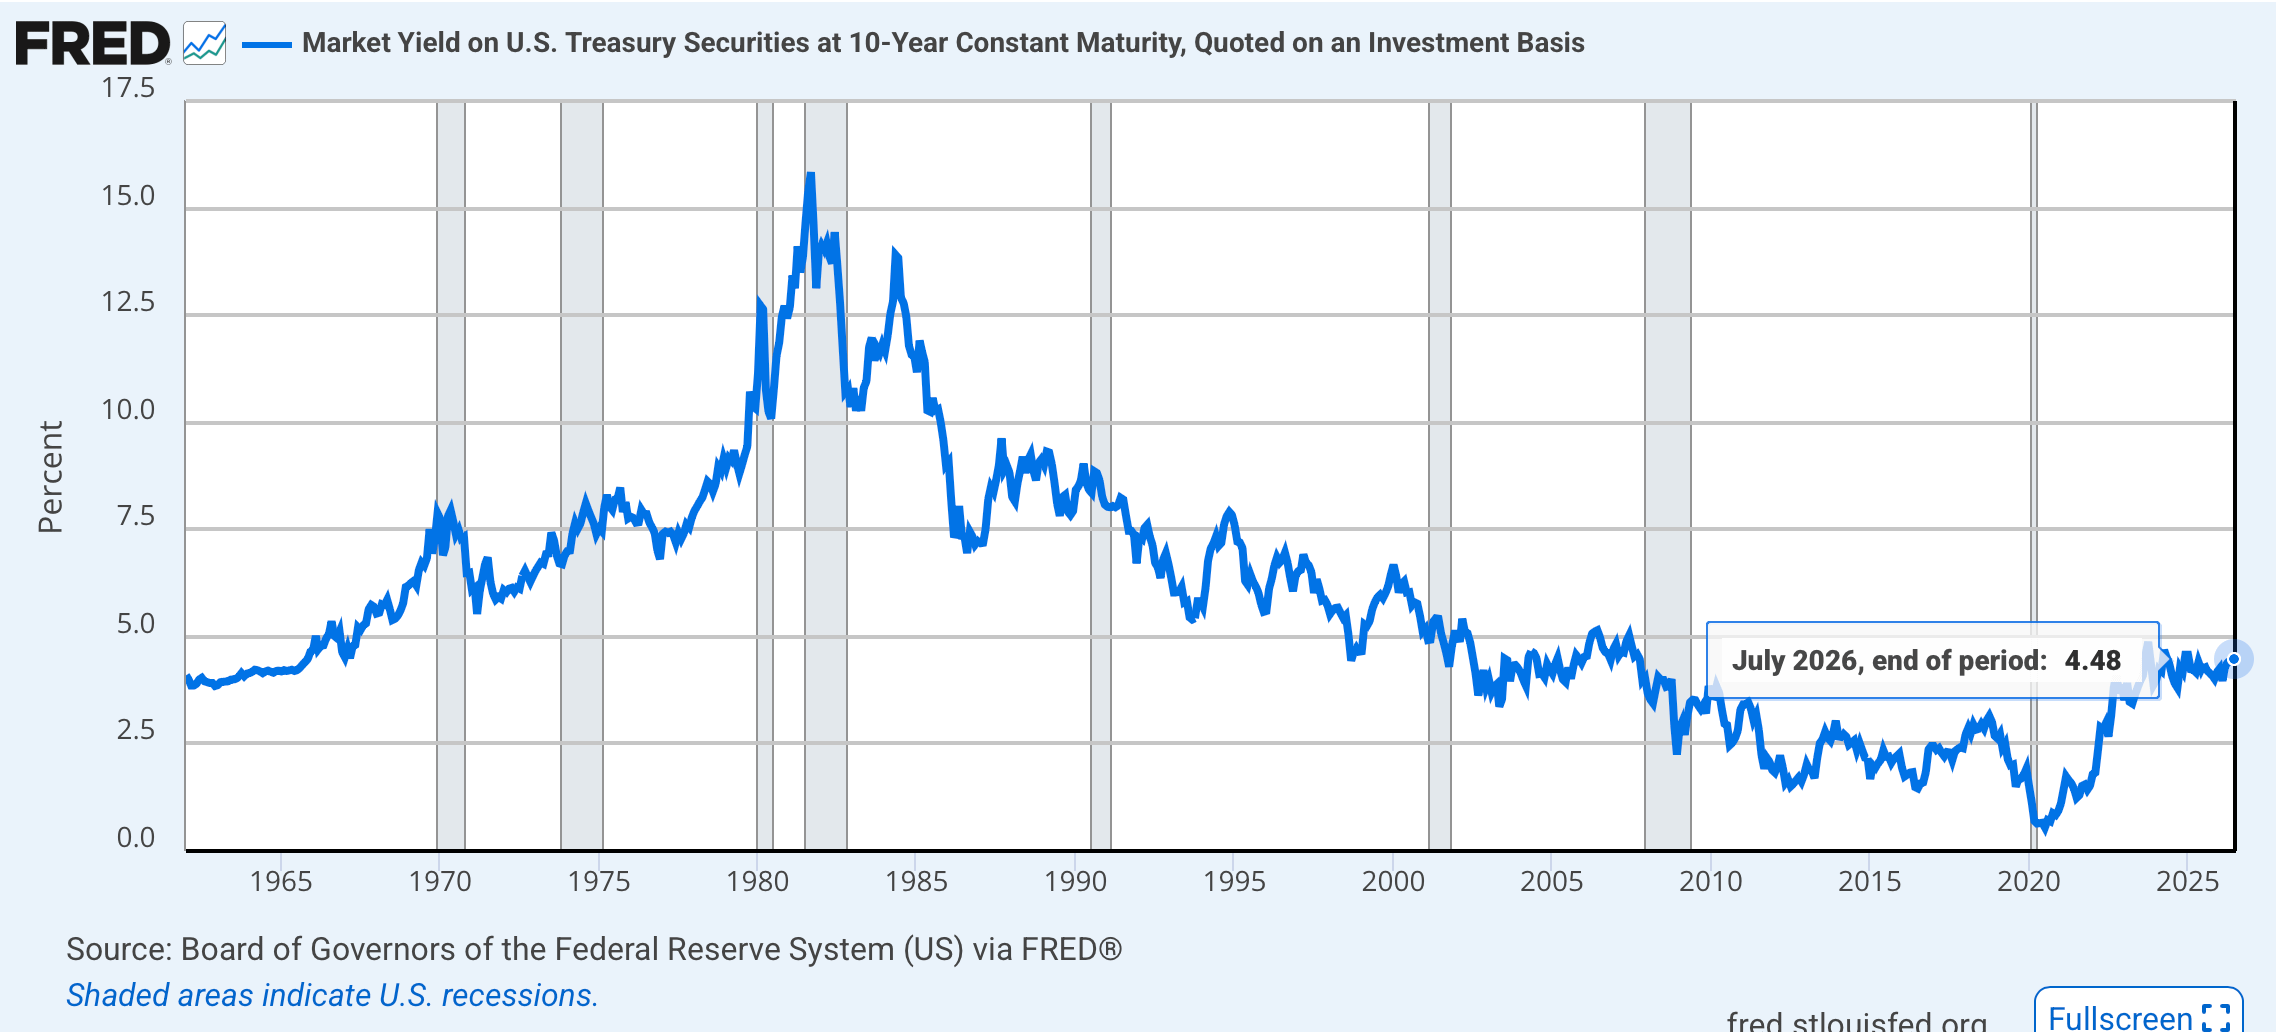
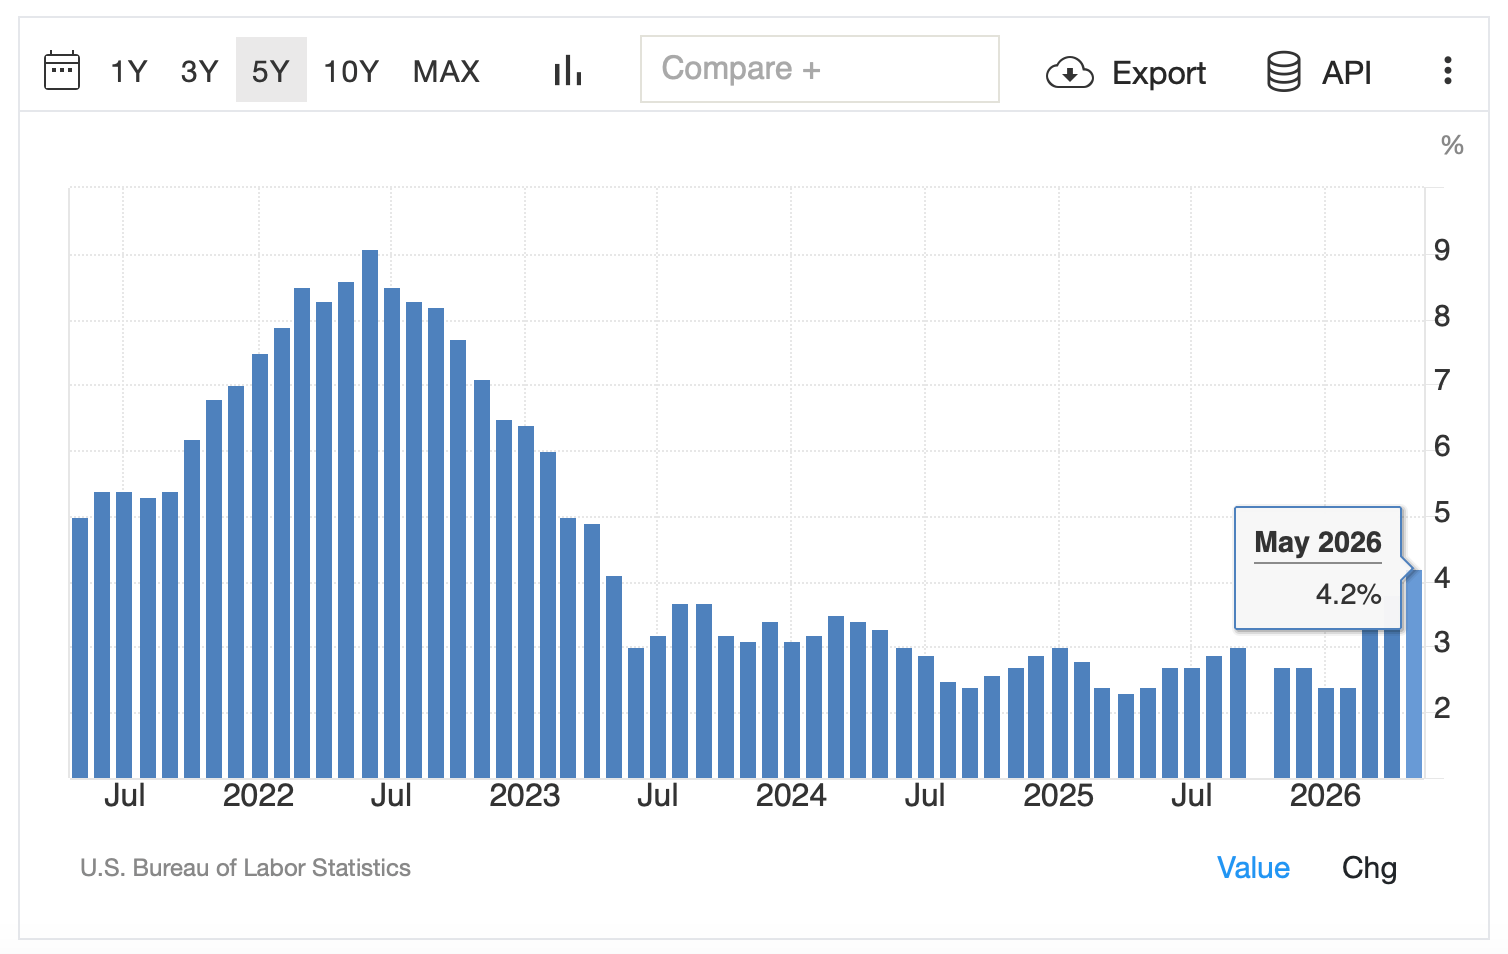
Ukraine and Russia are still at war and we’re fighting with Iran, which wants control of the Strait of Hormuz. U.S inflation rose to 4.2% due to this conflict.
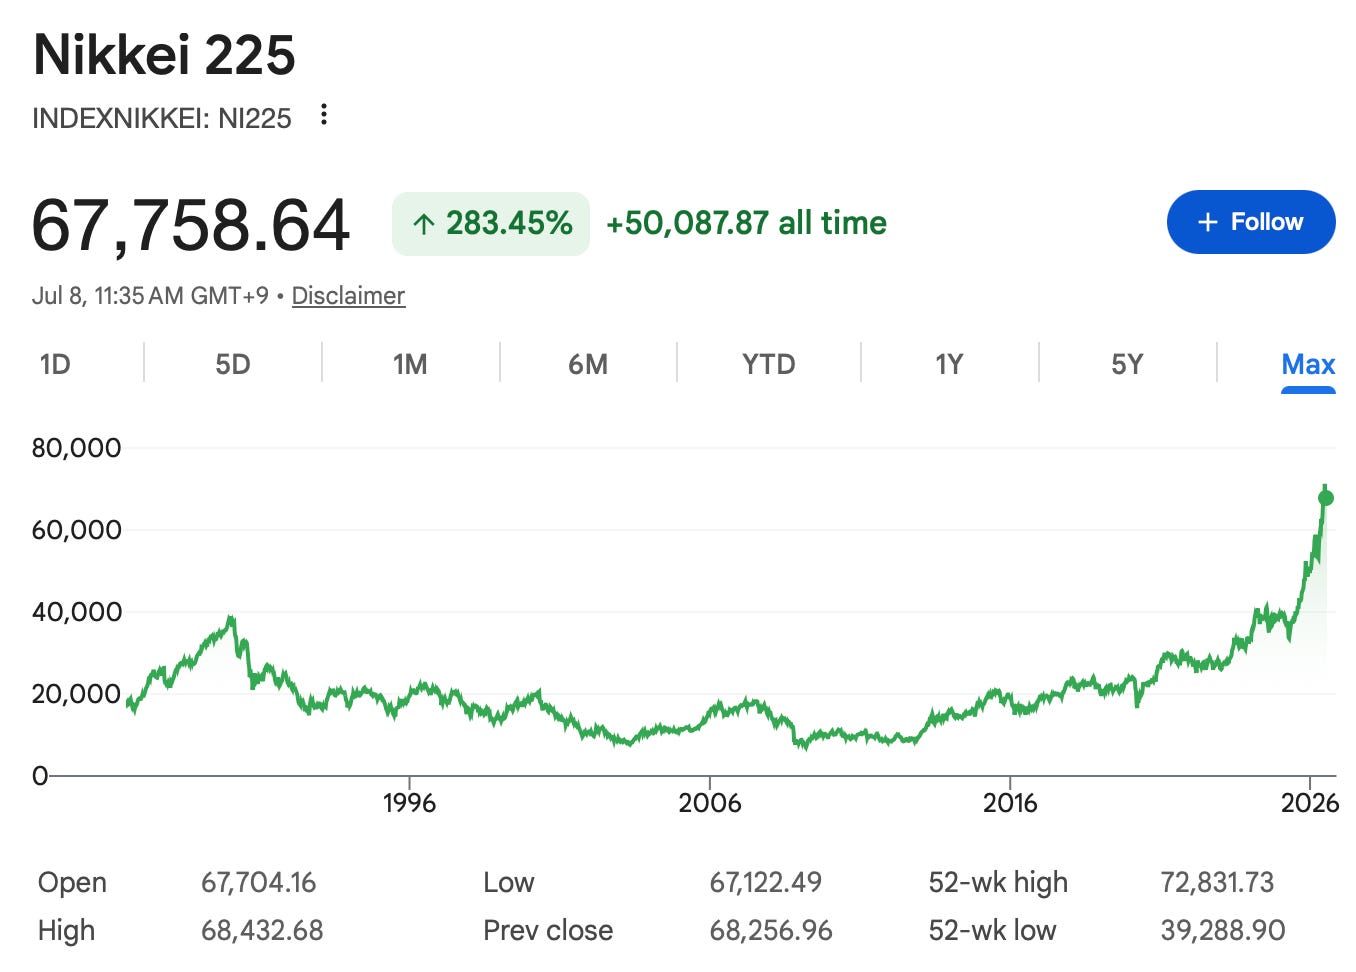
Now the market thinks the Fed is unlikely to cut and the ECB hiked rates last month for the first time since 2023. Japan hiked as well. The Nikkei 225, S&P 500, and EU50 are up 30.8%, 9.4%, and 8.0% year to date, respectively.
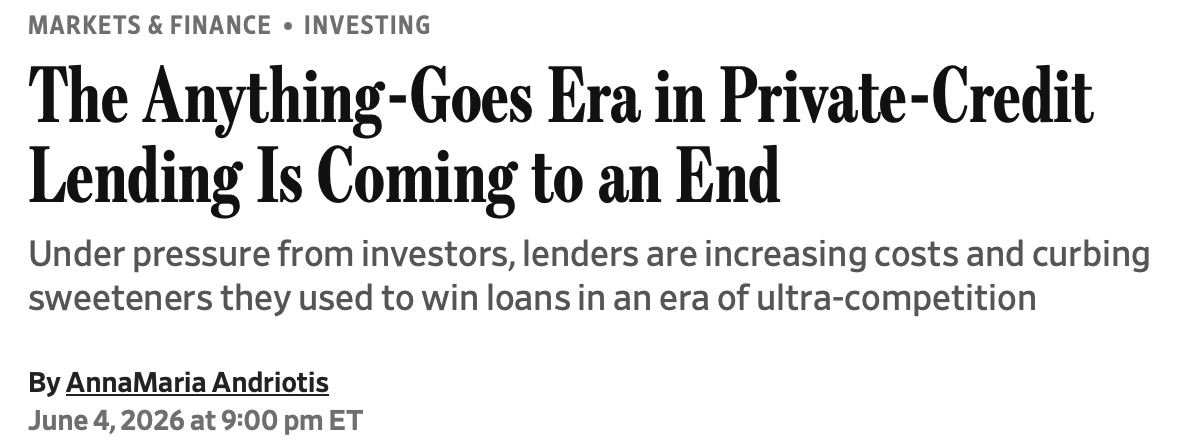
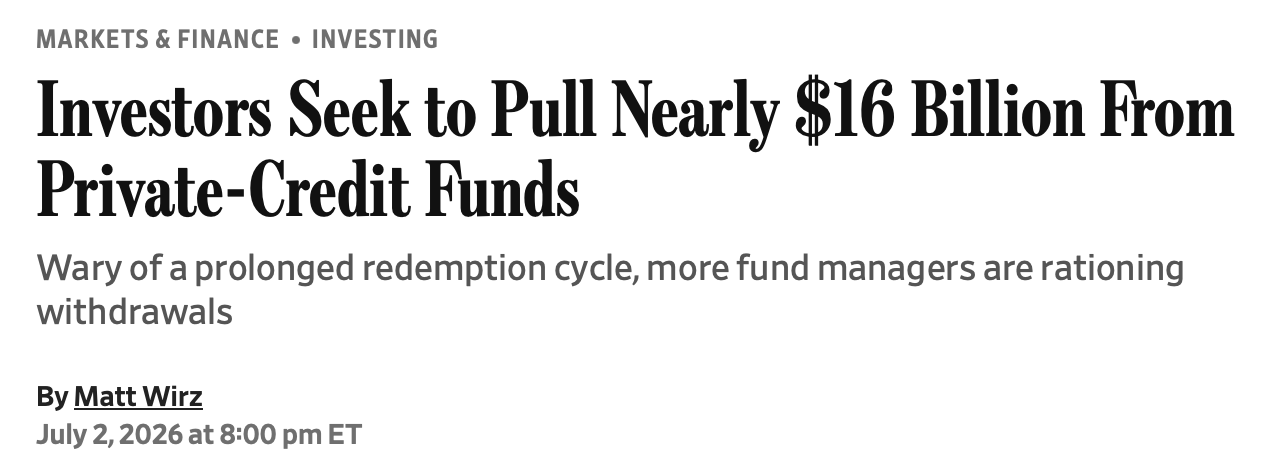
Private credit’s default rate stood at 6.0% in May 2026. Fitch calculates the U.S. Private Credit Default Rate (PCDR) as a blended, trailing-12-month figure that combines two components:
MCO (Model-based Credit Opinion): 4.9% — uses statistical modeling to estimate defaults across private credit loans that are not individually rated.
PMR (Privately Monitored Rating): 9.5% — actual observed defaults on the smaller, rated subset.
Fitch weights these (giving more influence to the larger MCO universe) to arrive at the headline 6.0% blended rate. This figure has been at record highs since April and is elevated for a period when the U.S. economy is not officially in recession.
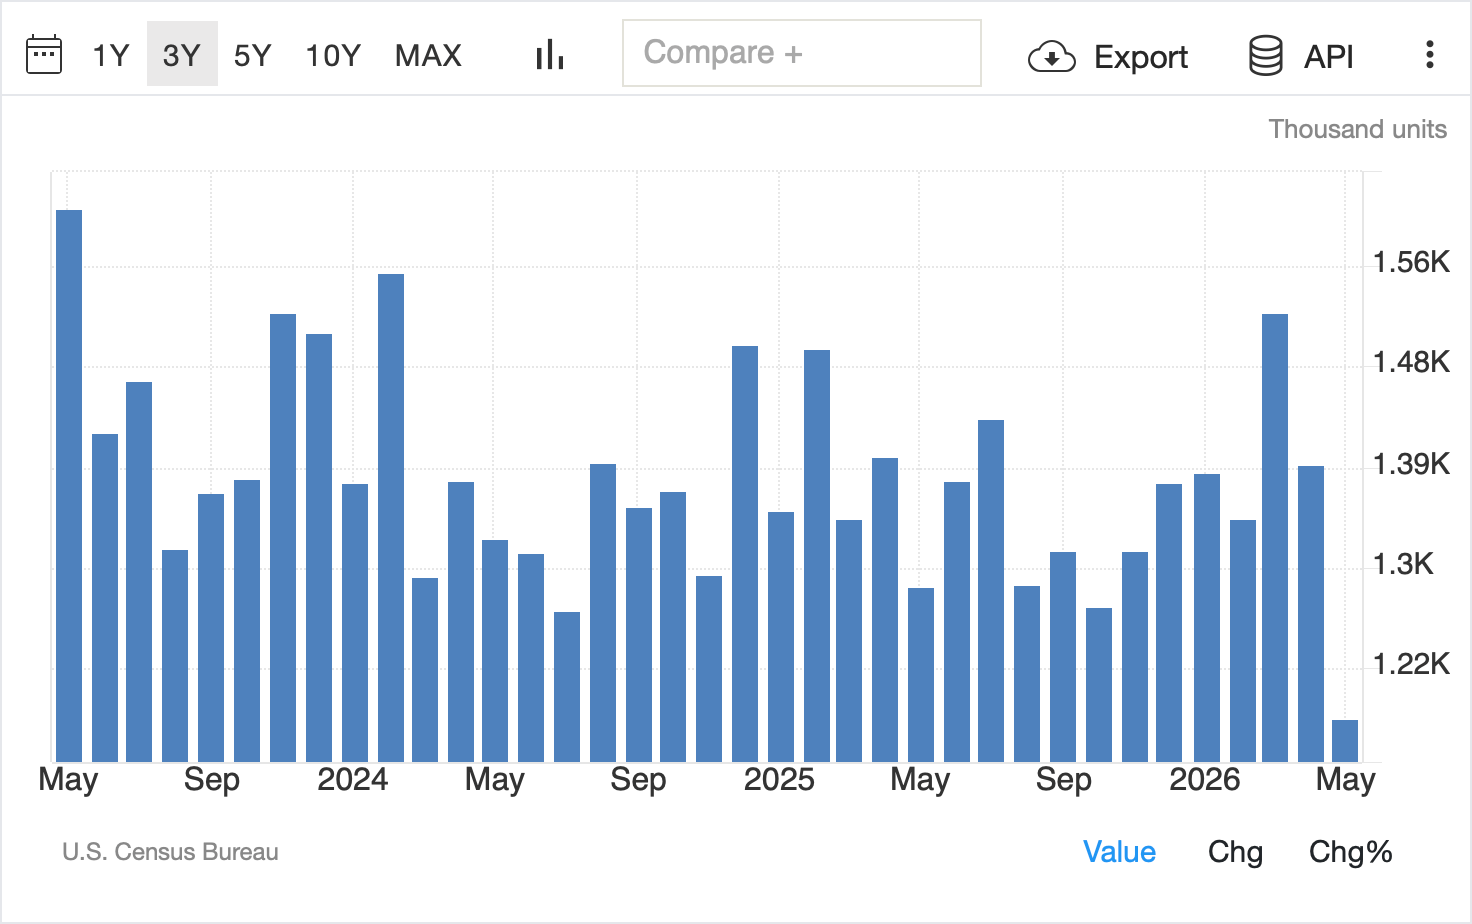
US housing starts fell 15.4% month-on-month in May 2026 to 1.177 million, the lowest since May 2020, missing forecasts of 1.43 million. Multi-family starts plunged 41.6% while single-family starts dipped 1.9%.
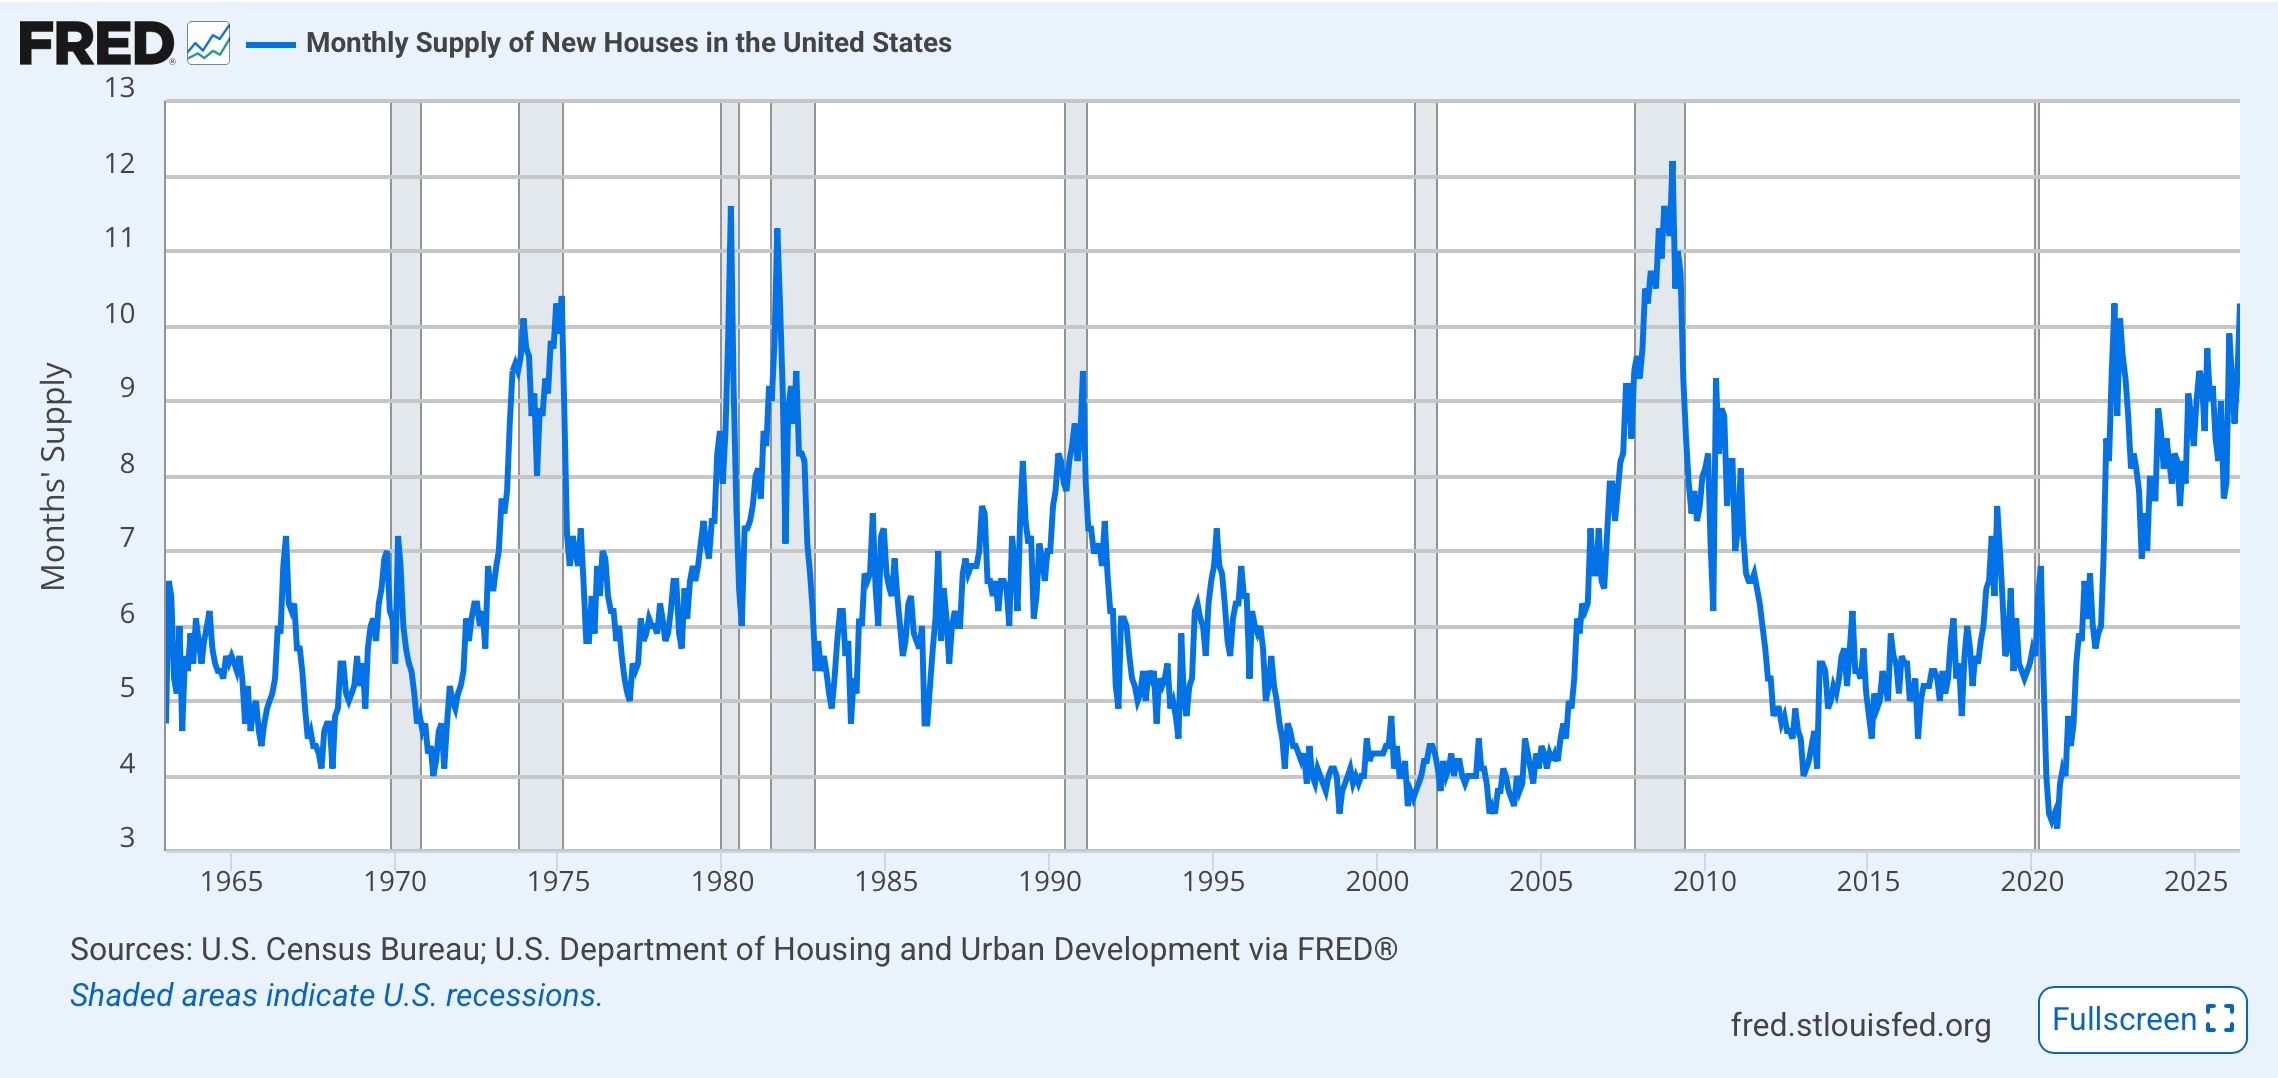
Monthly supply of new homes is 10.3. The all-time high is 12.2 (Jan 2009).
“I’m telling you right now, you can’t hedge yourself like being only cash at a time.” — DT
He could literally give the identical speech today. The big difference - and it's far worse - we are in year 4 of a bond bear market. Your charts clearly show the sustained rise in yields. It's a slow burn, but it's painful. As more debt rolls to higher rates (both public and private), the contraction in cash flows is significant.