
Graham as a guide
"Can such heedlessness go unpunished?"

In Sunday’s post, I wrote again that the stock market was way overvalued, virtually my entire portfolio is allocated to treasury bills, and that I’m not making investments “until things cool off”.
I reached this conclusion by trying to price the stock market as Graham does in chapter three of “The Intelligent Investor” titled “A Century of Stock-Market History: The Level of Stock Prices in Early 1972”.
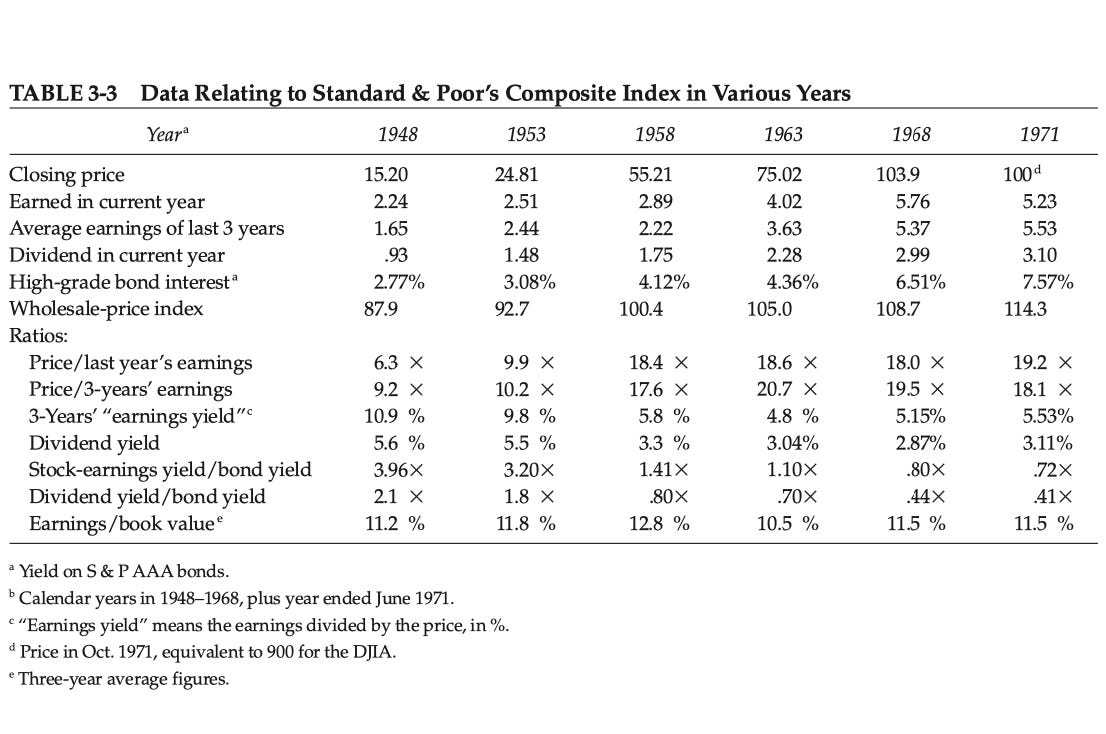
In it, Graham breaks down the period from 1948 to late 1971, during which both interest rates and stock multiples substantially increased. The second time this phenomenon occurred was from 2012 to the present.
Below are some paragraphs from the chapter.
“The investor’s portfolio of common stocks will represent a small cross-section of that immense and formidable institution known as the stock market. Prudence suggests that he have an adequate idea of stock-market history, in terms particularly of the major fluctuations in its price level and of the varying relationships between stock prices as a whole and their earnings and dividends. With this background he may be in position to form some worthwhile judgement of the attractiveness or dangers of the level of the market as it presents itself at different times.”
“Between the low level of 162 for “the Dow” in mid-1949 and the high of 995 in early 1966, the advance had been more than sixfold in 17 years – which is at the average compounded rate of 11% per year, not counting dividends of, say, 3 1/2% per annum. (The advance for the Standard & Poor’s composite index was somewhat greater than that of DJIA – actually from 14 to 96.)
The S&P’s trailing 17-year annualized return of 15.67% (dividends reinvested) is tenfold. From 2009 to 2026, the index advanced from 770 to 6800.
“These 14% and better returns were documented in 1963, and later, in a much-publicized study. It created a natural satisfaction on Wall Street with such fine achievements, and a quite illogical and dangerous conviction that equally marvelous results could be expected for common stocks in the future. Few people seem to have been bothered by the thought that the very extent of the rise might indicate that it had been overdone. The subsequent decline from 1968 high to the 1970 low was 36% for the Standard & Poor’s composite (and 37% for the DJIA), the largest since the 44% suffered in 1939-1942, which had reflected the perils and the uncertainties after Pearl Harbor. In the dramatic manner so characteristic of Wall Street, the low level of May 1970 was followed by a massive and speedy recovery of both averages, and the establishment of a new all-time high for the Standard & Poor’s industrials in early 1972.”
“To us, the early-1971-market’s disregard of the harrowing experiences of less than a year before is a disquieting sign. Can such heedlessness go unpunished? We think the investor must be prepared for difficult times ahead – perhaps in the form of a fairly quick replay of the 1969-1970 decline, or perhaps in the form of another bull-market fling, to be followed by a more catastrophic collapse.”
Of course, Graham was spot on. The S&P’s return for 1972 was 18.76%, and declines of 14.31% and 25.90% followed in 1973 and 1974, respectively. The index peaked at 118 in January 1973 and bottomed at 67 in December 1974, a 43% decline.
Before the crash, Graham observed that the S&P’s price to last year’s earnings ratio of 19.2 (a yield of 5.2%) was not too high by itself, but when compared to triple-A bonds, which yielded 7.57%, “the implications become less favorable”. Graham also highlighted the fact that stock and bond yields had completely reversed during this period.
Now, let’s look at some S&P metrics over the last quarter-century in the same increments as Graham did roughly half a century ago.
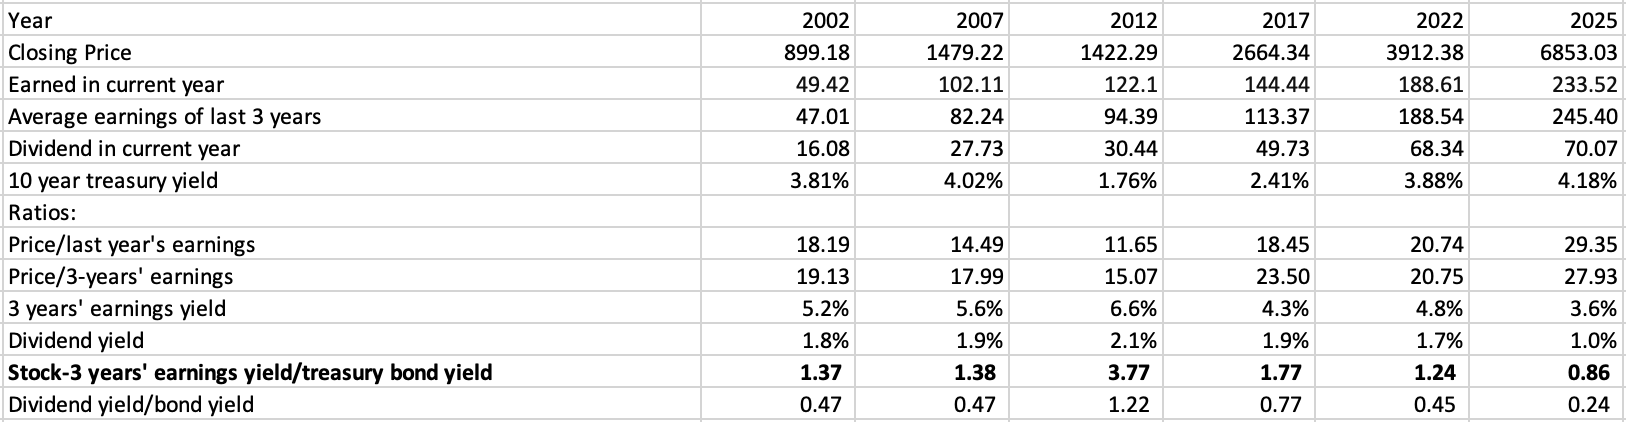
Stock and bond yields also reversed. The ten-year treasury yield increased from 1.76% in 2012 to 4.18% in 2025, and the three-year average earnings multiple increased from 15 to 28 over the same time. In other words, the bond yield increased 138% and the three-year average earnings multiple increased 87%.
Stocks are defying gravity just like they did from 1948 to 1972, when the high-grade bond yield increased 173% from 2.77% to 7.57%, and the three-year average multiple increased 97% from 9.2 to 18.1.
“We think the investor must be prepared for difficult times ahead – perhaps in the form of a fairly quick replay of the 1969-1970 decline, or perhaps in the form of another bull-market fling, to be followed by a more catastrophic collapse.”
For 1969-1970, read “2022”.