
Concentration squared
+ Bermuda, HNNA, MCS, LGL, NEN, CLW, Schloss's list of owned stocks, PYPL, PLTR

Index concentration is at an all-time high. NVDA, AAPL, MSFT, AMZN, GOOG, META, and TSLA account for roughly 33% of the S&P 500.
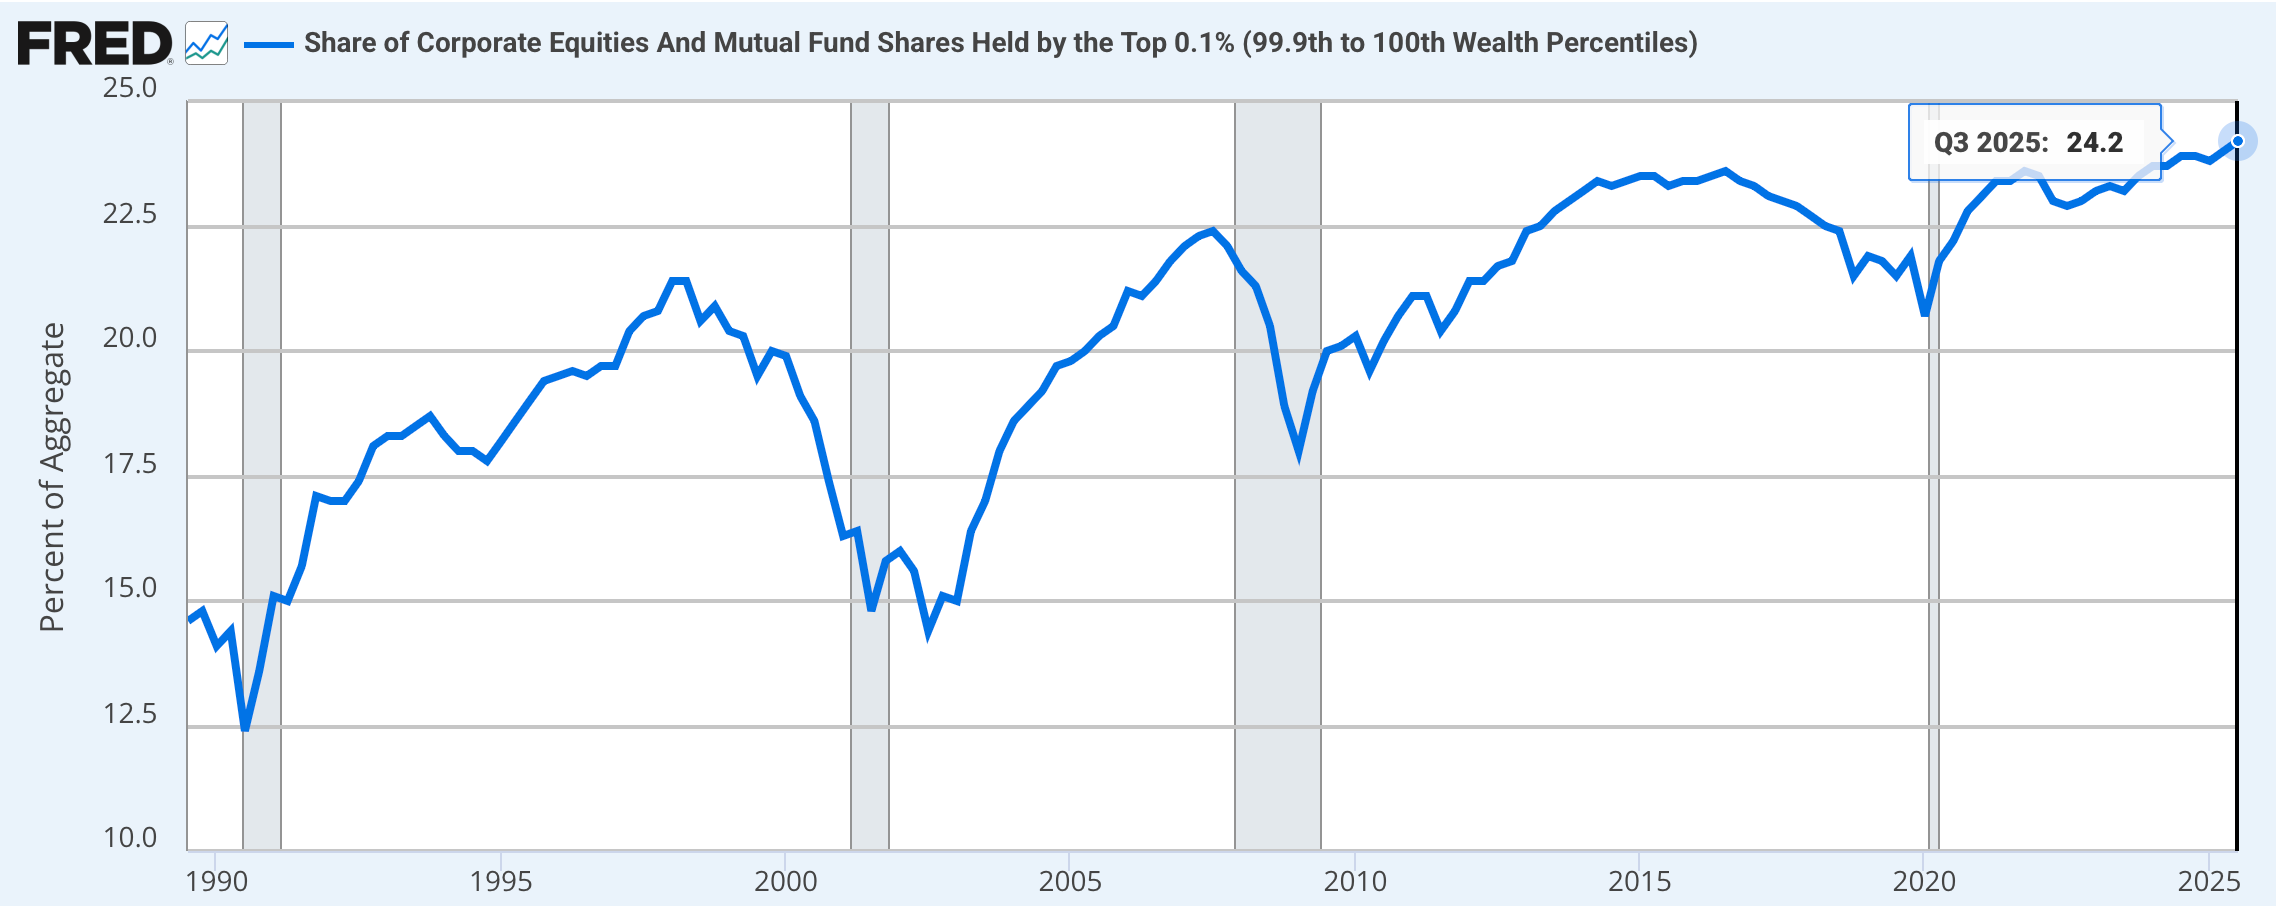
Stock ownership concentration is at an all-time high. The wealthiest 0.1% of U.S households own 24% of the stock market. That is approximately 134,000 households holding $16.8 trillion in equities. The top 1% own 50% — 1.3 million households holding $35 trillion in equities. The top 10% own 90% — 13.3 million households holding $63 trillion in equities.
This decile also accounts for 50% of consumer spending, which is around 35% of GDP. Stocks go up, confidence rises, and spending follows. At some point, this cycle will flip, and it will be painful or cathartic depending on how you are positioned. Unfortunately, however, it is impossible to time the market, and far more air could get pumped into this bubble.
AMZN, GOOG, META, and MSFT are spending $600+ billion of capex in 2026, an approximate 67% increase from last year, and SpaceX, OpenAI, and Anthropic are in talks to go public. Plus, the Dow just hit 50,000 — another all-time high — and Warsh is set to lower rates this summer. There’s a lot to be excited about.
As there was in 1996 too. Stock market returns were fat, and the Dotcom bubble was forming, prompting Fed chair Alan Greenspan to ask that December, “how do we know when irrational exuberance has unduly escalated asset values, which then become subject to unexpected and prolonged contractions as they have in Japan over the past decade?”
The Shiller ratio was about 28 then, which seemed crazy because the last time such lofty levels occurred was the roaring 20s preceding the Great Depression. The stock market continued to boom, however, leaving bears in the dust. In January 1999, the Shiller ratio hit 40 for the first time before dipping back under 40 in October 2000.
A little over a quarter of a century later, the Shiller hit 40 again for the second time. The S&P 500 closed around 6,900 yesterday on $170 of cyclically adjusted earnings. Capitalize this figure at 16x (long-term median), and the S&P 500’s fair value is 2,720. It’s a long way down.
Also worrisome is the “Bermuda Triangle Strategy” led by Apollo, KKR, Ares, Blackstone, Brookfield, and Carlyle.
“A three-cornered business strategy involving a large asset manager, a U.S. life insurer, and a reinsurer based in an offshore regulatory haven. These asset managers are typically leading players in the private equity and private credit markets. The asset manager buys a life insurer and manages its assets. The life insurer sells annuities to U.S. retirees, generating a steady funding stream, then allocates those funds to the affiliated asset manager’s high-yield “alternative” assets while reinsuring its downside risk with an offshore reinsurer in a jurisdiction like Bermuda or Grand Cayman.”
“The FSOC’s 2025 Annual Report states that in 2024 U.S. life insurers ceded $2.4 trillion of reserves to reinsurers, a 70% increase from $1.4 trillion in 2019.”
Throwing retirement money into private credit probably won’t end well. Full read here: https://natlawreview.com/article/bermuda-triangle-and-growing-risk-insurance-markets
While I’m pessimistic on stocks with an 80% cash position, I’m still looking. Here are some interesting ones.
HNNA is a small asset manager with a $80 million market and $47 million enterprise value. $4.3 billion in AUM. Trailing EBIT of $13.2 million, so trading at 3.5x EV/EBIT. CEO owns 26% of shares outstanding. DHIL is set to be acquired by First Eagle for around 9x EV/EBIT.
MCS owns 78 theatres and 985 screens across 17 states, as well as 7 hotels. Stock is down about a third on the year. Market cap is $465 million and enterprise value is $800 million. Gross property and equipment is $1.5 billion. Of the 78 theaters, MCS owns 68% of the real estate beneath them. This segment produced roughly $80 million in EBITDA last year, and the hotels $40 million.
LGL’s market cap is $37 million. Cash on the balance sheet is $42 million. No debt. Mario and Marc Gabelli own nearly 40% of shares outstanding. Gabelli Funds another 8.5%. On Dec. 30, 2025, Mario Gabelli purchased 95,387 shares at $4.75 ($453,088). Current price is $6.68.
NEN great write up here -- obscurestocks.com/p/new-england-
“The portfolio consists of 3,411 apartment units, 19 condos, and about 159,000 square feet of commercial space. It is concentrated in Eastern Massachusetts, with one property in Southern New Hampshire.”
“The JV portfolio includes 688 apartment units, 12,500 square feet of commercial space, and a 50-car parking lot. NERA’s affiliate, The Hamilton Company, serves as property manager for the portfolio and joint venture investments.”
“With $564 million of net debt (including unconsolidated JV net debt) and a ~$242 million market cap, NERA trades at a ~7.5% cap rate on my 2026 estimates, and about a 10% levered free cash flow yield.”
CLW seems like a Schloss stock. Schloss actually bought Potlatch in ‘85, and Clearwater was spun off from them in ‘08.
Clearwater trades at 0.36x book value. Debt jumped to $50 million in Q2 and now accounts for 50% of equity. I’d like that lower given the low quality of earnings and lack of insider ownership/buying.
But I do like their debt trend. CLW acquired a mill from Graphic Packaging for $700 million, sold its consumer products division to Sodifel for $1.1 billion, and used the $850 million of net proceeds to pay down debt. Now they’re a pure paperboard manufacturer, an attractive acquisition target.
CLW also authorized a $100 million buyback, repurchasing around $17 million to date, with buys made in the mid to high twenties. The stock has traded in the high teens as of late, but they’ve stopped buying.
2020 notes at 4.75% mature in 2028, so they will soon face a significant interest rate spike. $275 million of debt at 10% is $27.5 million of interest expense. Not ideal, but not that bad either.
CLW currently trades well below its private market value. However, I’m hesitant to purchase because of the leverage mixed with business cyclicality and lack of insider ownership.
Speaking of Schloss stocks, here’s a long list of ones he owned: https://static1.squarespace.com/static/5886cbc4a5790a5c18741c5a/t/669f37b82eb5af1a35bfa05f/1721710521163/schloss+-+list+of+stocks+-+january+2007.pdf
To end, I don’t understand either business, but I thought it was interesting that Palantir’s market cap is ten times larger than PayPal’s, considering Palantir’s technology was inspired and built upon fraud detection systems first developed and used at PayPal.
PYPL is now down 84.5% over the past five years. Market cap is $39.0 billion. Free cash flow last year was $6.2 billion. Share buybacks totaled $6.1 billion.
PLTR is up 363.7% over the past five years. Market cap is $376.1 billion. “Free cash flow” last year was $449.6 million. Net share issuance totaled $627.4 million.
What's driving the large decline in AUM (14% YoY) in Hennessey Funds?
What’s the story with LGL?